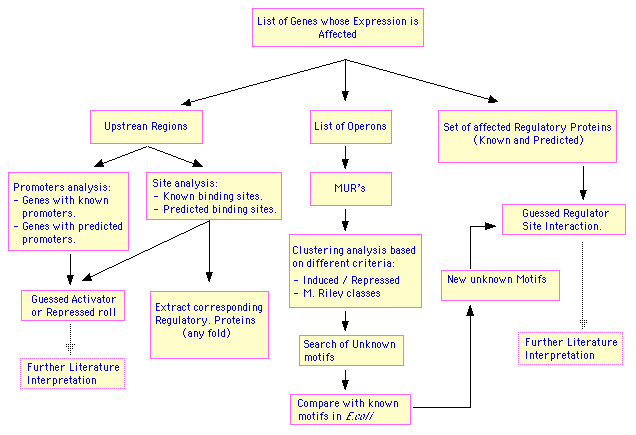
Flow Chart.
GETools is a set of concatenated and linked programs that extract
information to analyse data that come from microarray experiments. The
motivation for these programs is to facilitate a systematic automated comparison
between global expression data obtained by current chip and microarray
technologies, and whatever knowledge has been gathered from the literature
about transcriptional regulation and operon organization from E.coli
in RegulonDB. The diagram below shows the programs linekd in GETools.
These programs are aimed to answer questions such as:
1. How many operons are being induced and/or repressed?
2. Which are the known promoters and regulatory sites affecting the
set of genes in the micro-array experiment?
3. How many of the affected, induced or repressed, genes code for transcriptional
regulators?
4. How to quickly extract from the E.coli genome sequence the set of
upstream regions for further analysis?
These are preliminary questions necessary to provide a more organized and coherent view beyond a simple list of affected genes in the genome in an experiment. The web page contains a help and a demo. The input list for these programs is a table with a list of bnumbers and expresssion ratios. The output is selected from the user, and can include some or all of the following: I) the list of operons that contains all the genes in the input list; ii) the set of upstream sequences in fasta format (from 400 upstream to 50 downstream from the beginning of the gene) for either each gene, or each operon; iii) the list of known and predicted promoters either for each gene or for each operon, iv) the list of regulatory proteins contained within the input list; v) the list of both known and predicted sites for the binding of regulatory proteins within the upstream regions of each gene. MURs stand from 'minimal upstream regions' and refers to the smalles necessary set, given the known structure of operons and the expression profiles, that are required to account for promoters in the input list. Most of these output files can be obtained as tab-separated or excel files, or as a graphical description with different colors for the induced or repressed genes vs thebackground of unaffected genes in the operon set, this last graphic option was done using the "Feature-map" program by Jacques van Helden.